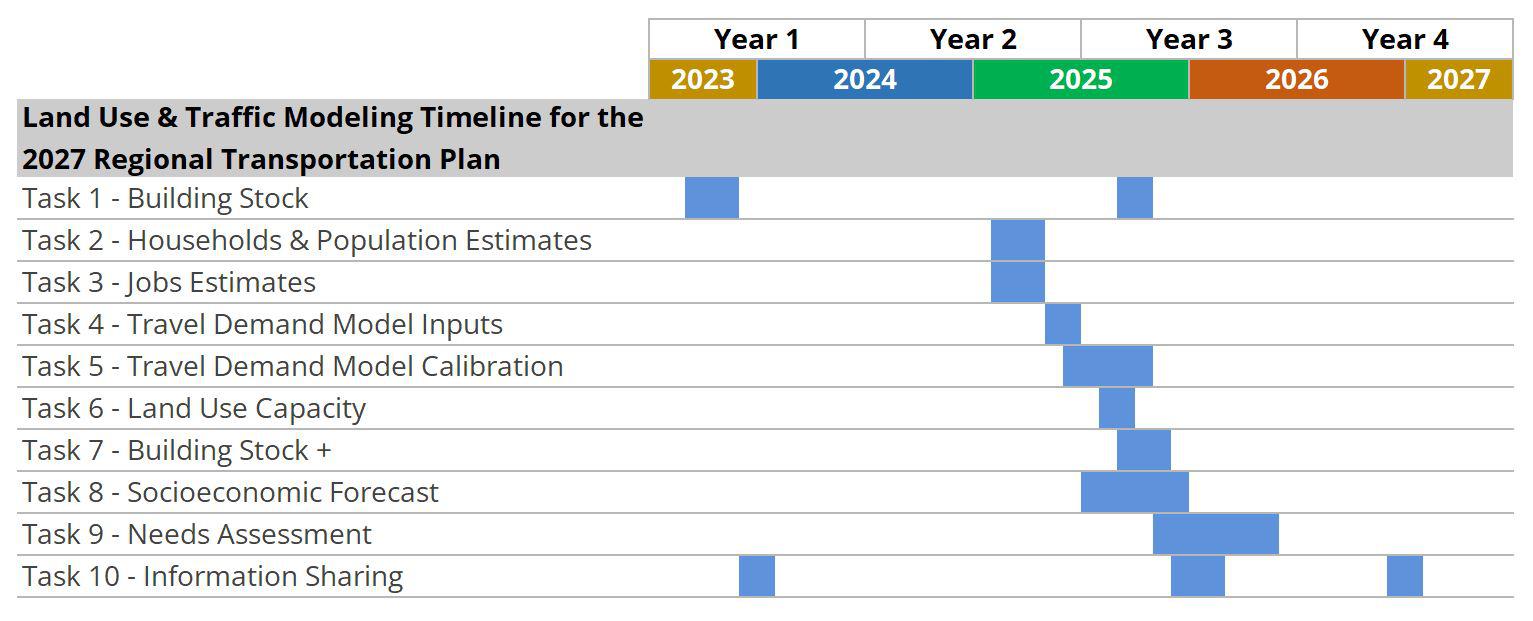
Land use & traffic modeling
Overview
MAG, as the Metropolitan Planning Organization (MPO), develops, gathers, processes, and models land-use and transportation data for various programs and applications. The most prominent is the Regional Transportation Plan (RTP). Updated every four years with the RTP are the Real Estate Market Model (REMM) and the Travel Demand Model (TDM). As per federal code, the RTP and models use "the latest available estimates and assumptions for population, land use, travel, employment, congestion, and economic activity." The most current year of available data is usually the first year of the planning cycle (2023) and makes a solid base for model comparison. Both models cover the entire Wasatch Front; MAG is a joint owner with the Wasatch Front Regional Council.
Land Use Modeling
The Real Estate Market Model (REMM) predicts the pattern of growth and development by simulating the dynamic interaction of households, jobs, real estate markets, and the regional transportation system within the constraints of local growth policies.
Traffic Modeling
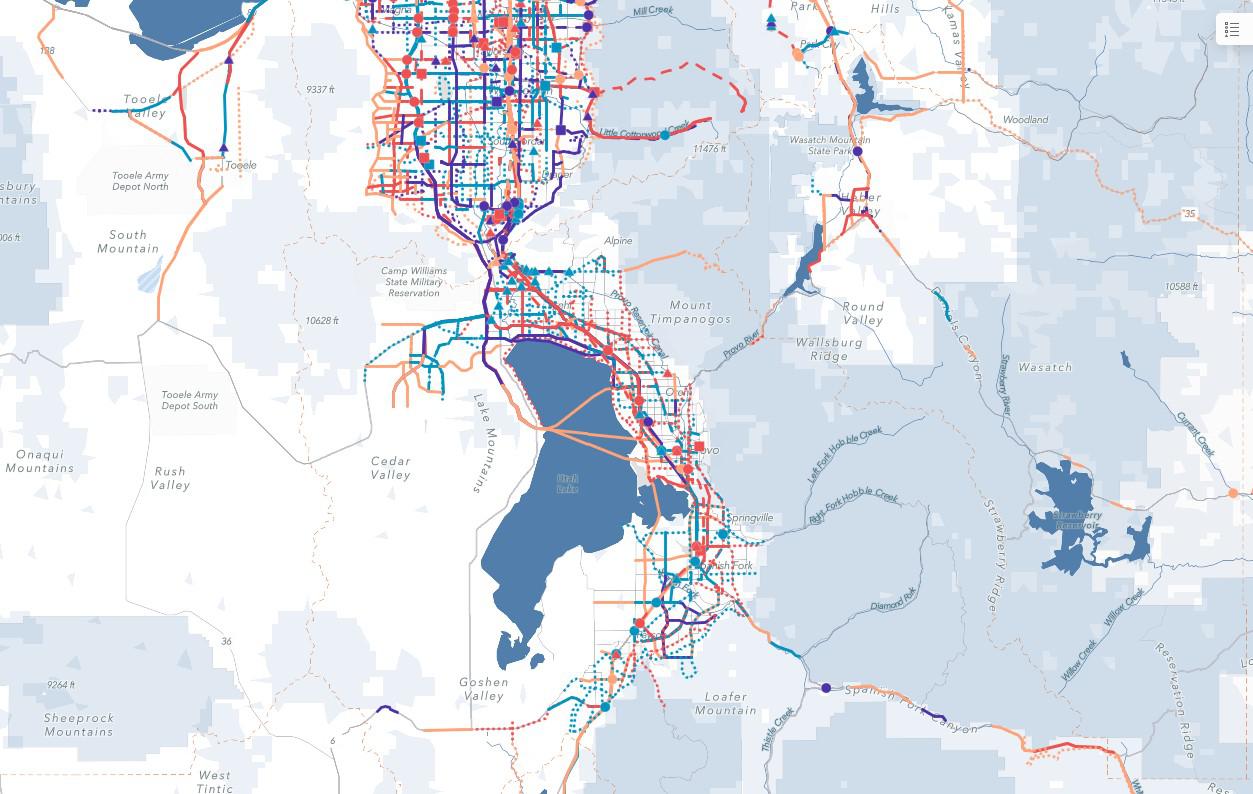
The Travel Demand Model (TDM) is a tool that measures the impact of changes in travel demand on the transportation system by testing various land use scenarios with different road and transit network configurations.
Task 1
REMM - Building Stock
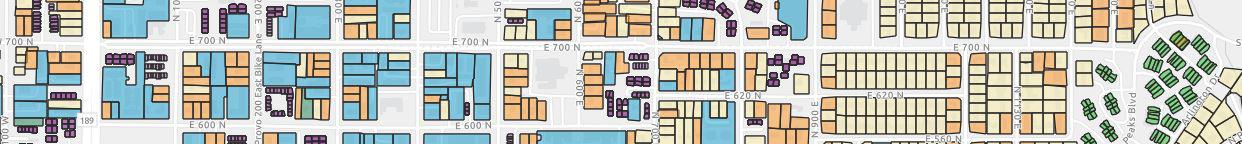
In the fall of 2023, GIS parcel building data is collected from the County Assessor's Office. The data consists of building type, year built, residential units, and square feet. Building parcel data often have missing or incomplete attributes. MPO staff use Nearmap imagery to prepare the data that has missing or incomplete attributes. The data then becomes an input into REMM.
Building Type
Multiple county attributes are used to group buildings into 6 main types:
Single Family Residential, Multi-Family Residential, Group Quarters, Industrial, Retail, and Office.
Year Built
Aerial imagery is used to estimate the year the building is completed if it's not provided in the data.
Residential Units
Count air conditioning units from aerial imagery, call apartment complexes, and/or verify in the field the number of units in a parcel.
Square Feet
Using aerial imagery, building footprints are created and the number of floors are defined; total square feet is calculated by multiplying the two.
Task 2
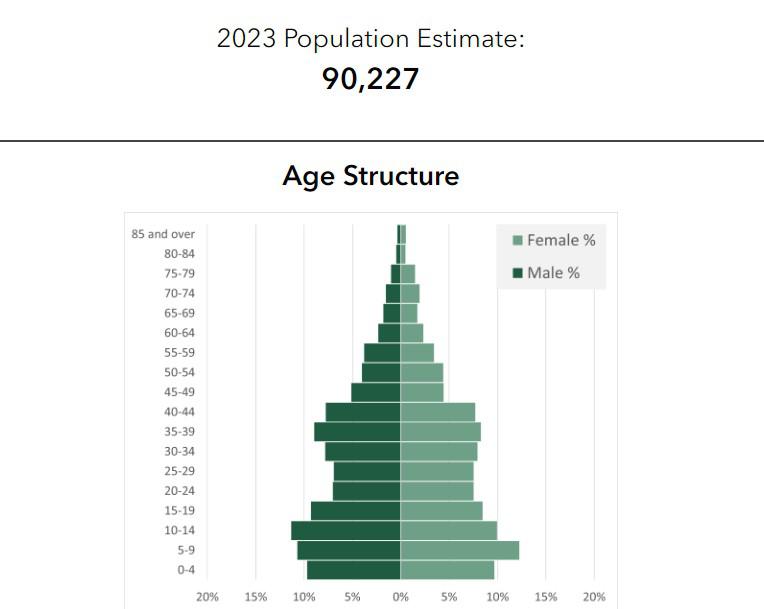
REMM - Households & Population Estimates
At the beginning of 2025, household characteristics, household size, and vacancy rates by city and Census block groups are collected from the American Community Survey (ACS) 2023 5-year estimates. Countywide households and population totals for 2023 are collected from the Kem C. Gardner Policy Institute. MPO staff use the ACS data and the building stock to determine where those totals are allocated in the county. These allocations make up the estimates. They are inputted into REMM and form the basis of the residential forecasts.
Step 1
ACS data is used to create a synthetic population with associated households and characteristics.
Step 2
REMM's residential location choice models allocate the county totals, using the synthetic population, into the available housing stock.
Step 3
Allocate the group quarters' population into the group quarters' building stock.
Step 4
The completed sub-county estimates are presented to the MPO Technical Advisory Committee for review and feedback.
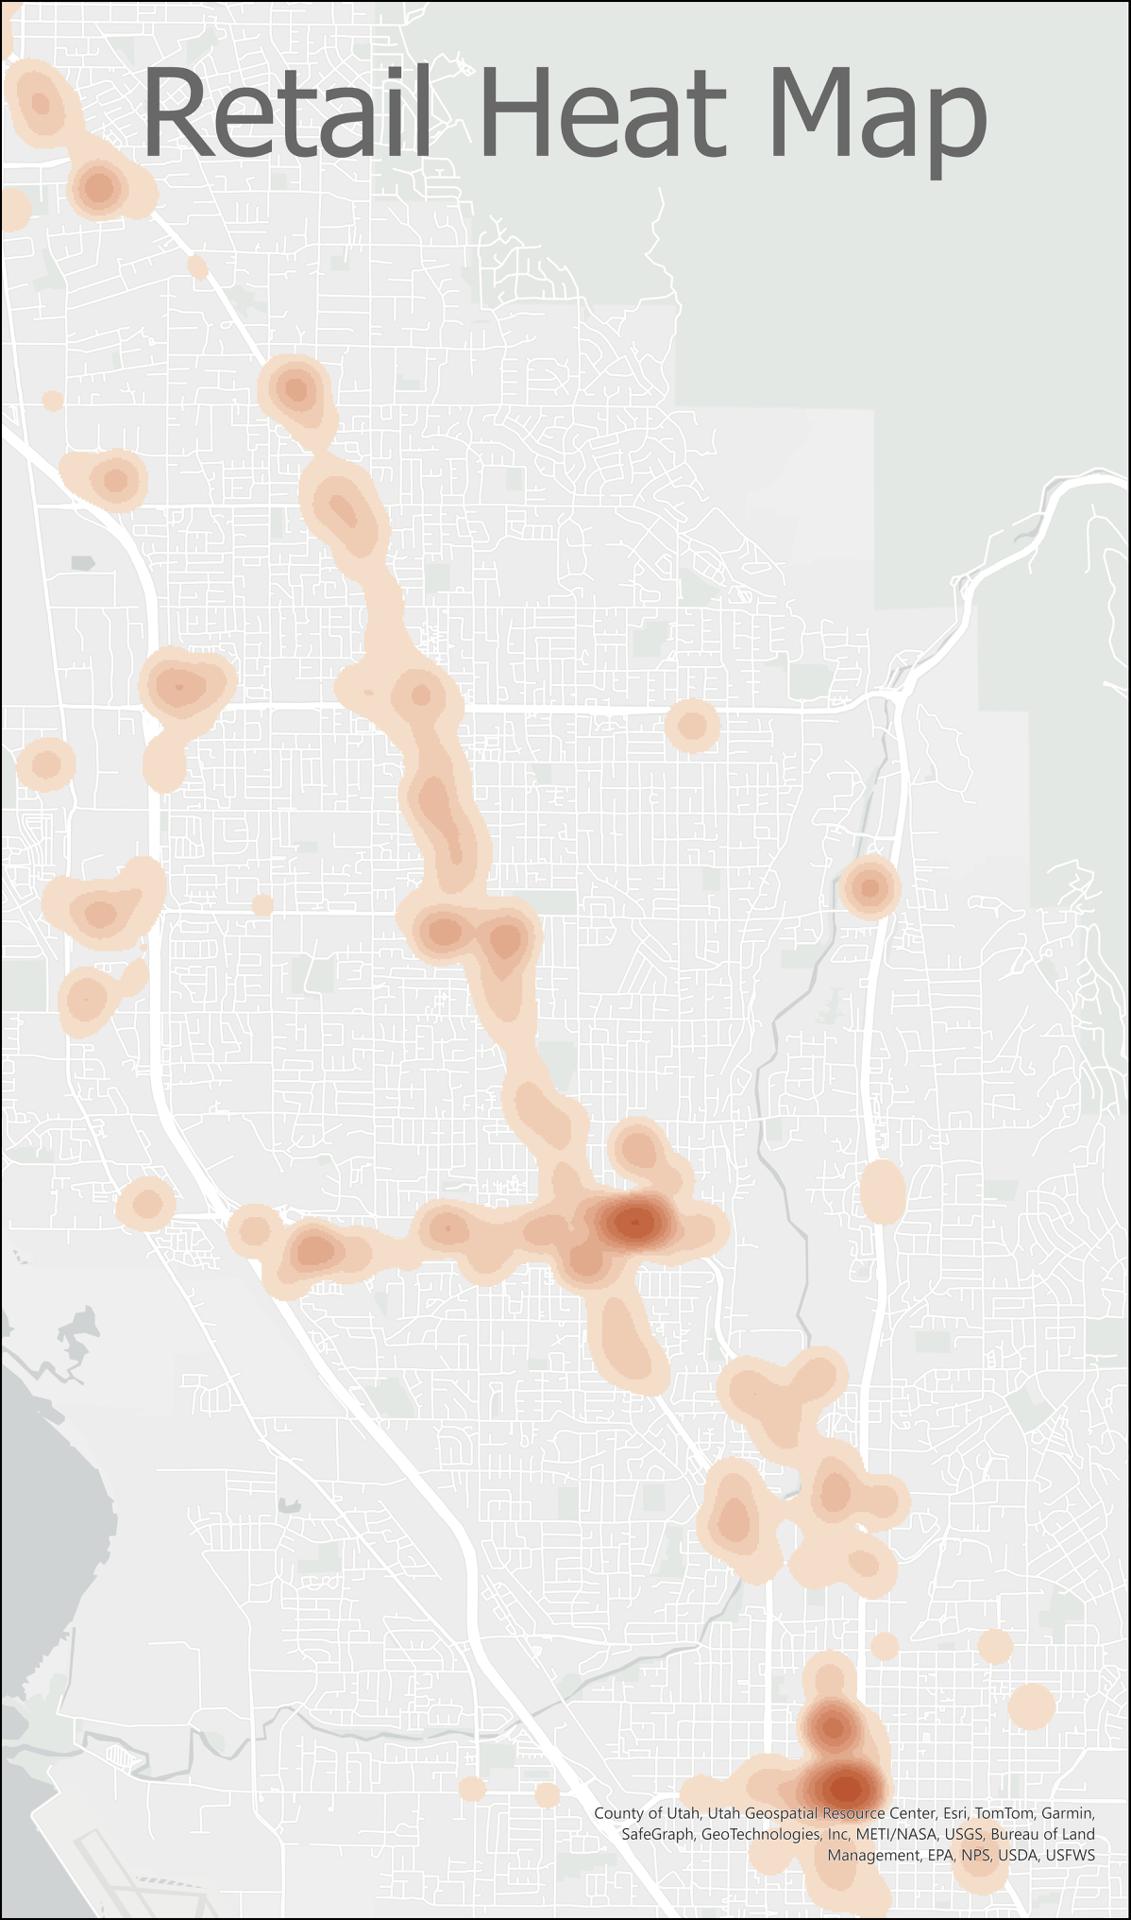
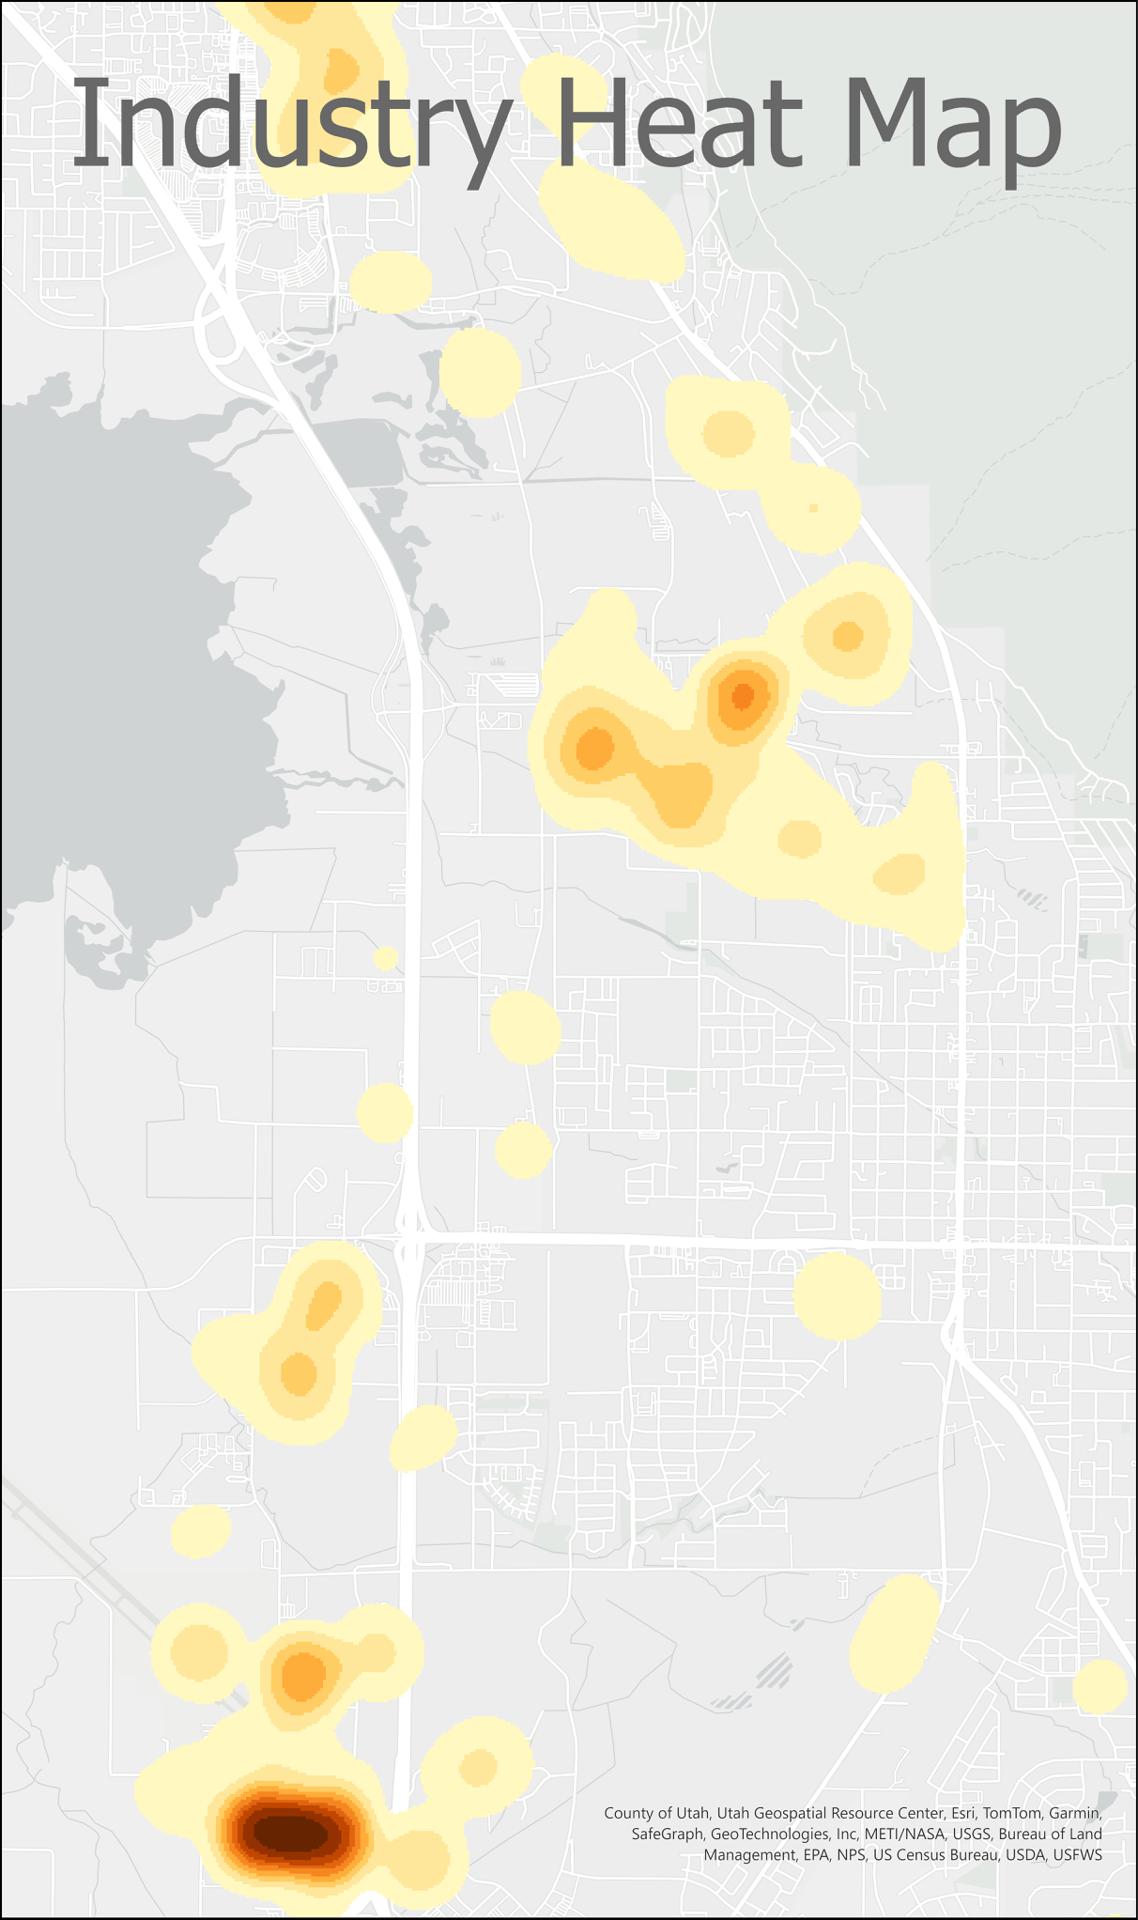
Task 3
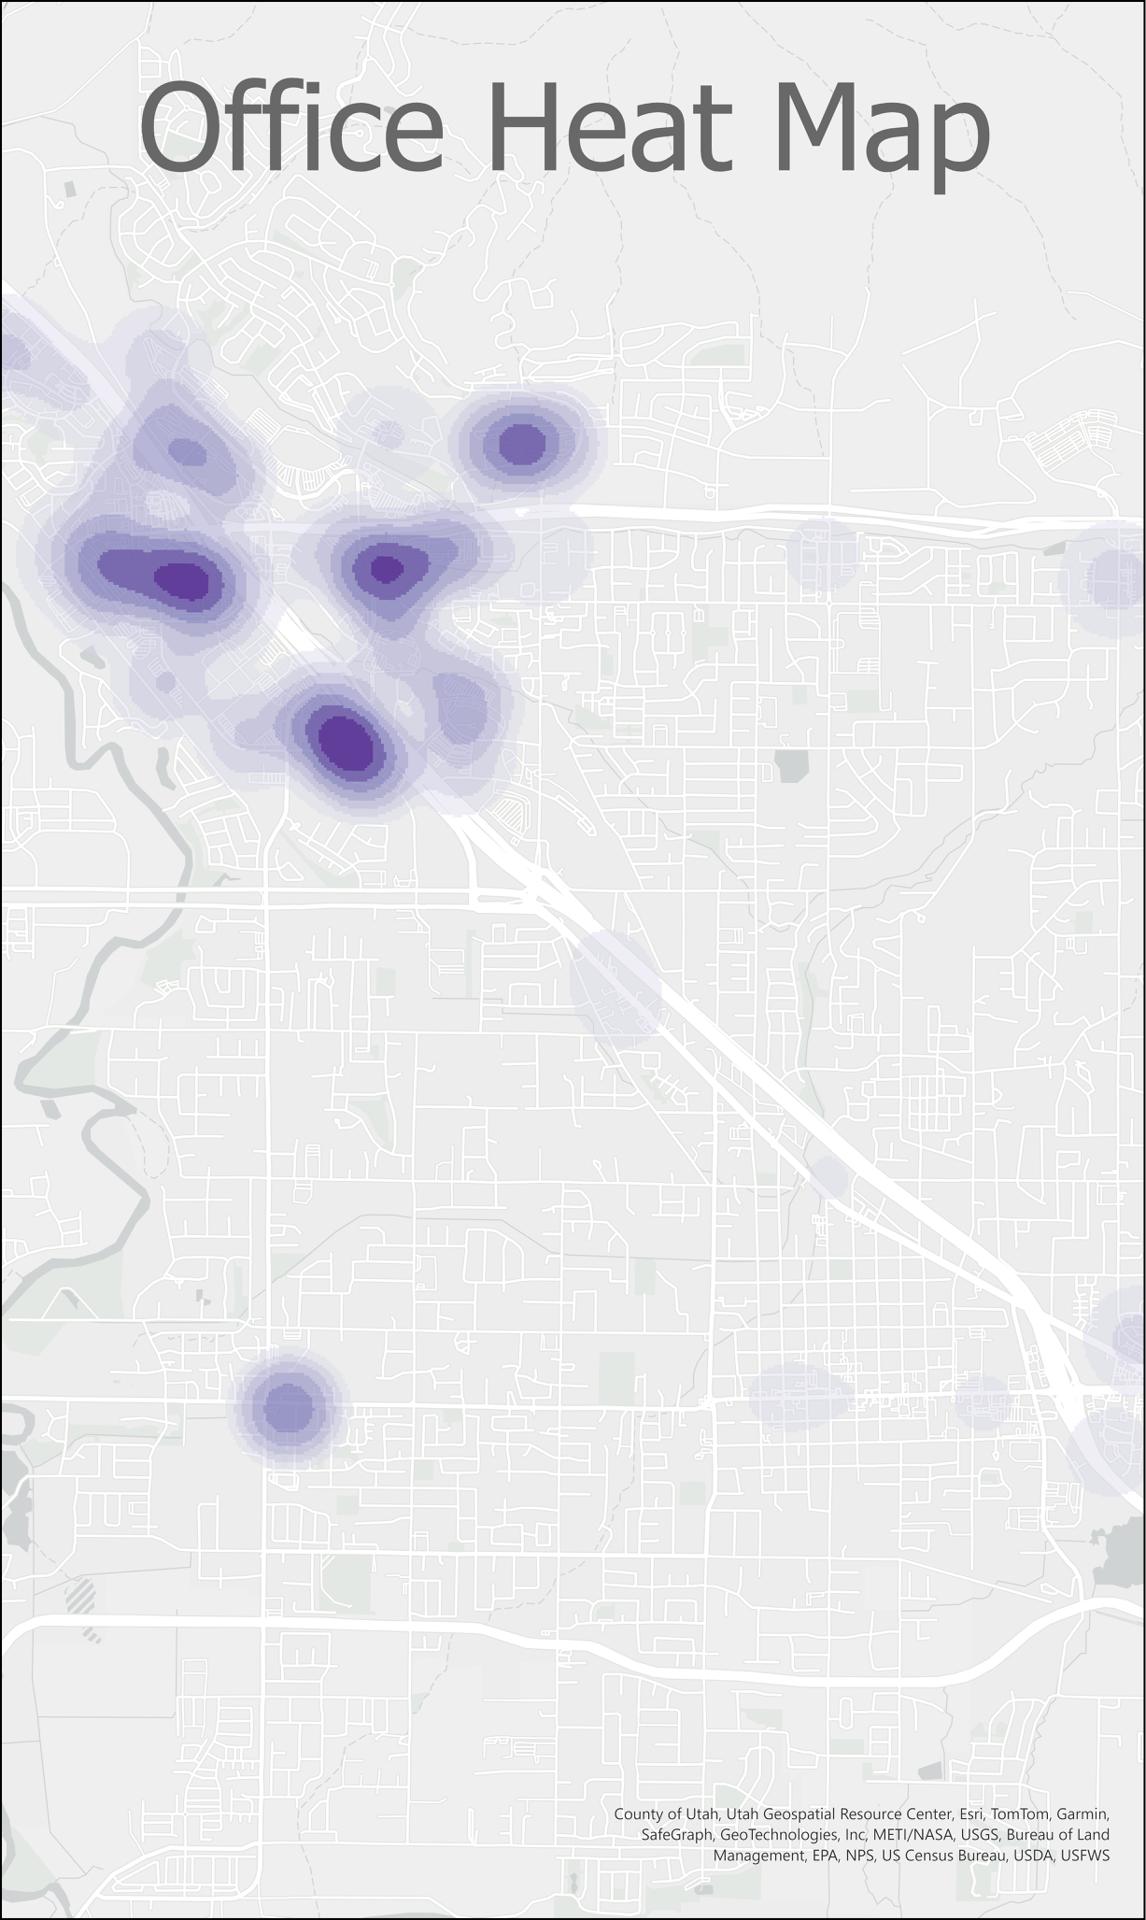
REMM - Jobs Estimates
By early 2025, employer data for 2023 is collected from the Utah Department of Workforce Services (DWS). The data includes employer address, industry, and number of employees. County-wide totals for employment by industry for 2023 are collected from the Kem C. Gardner Policy Institute. MPO staff use the DWS data and the building stock to determine by industry where those totals are allocated in the county. These allocations make up the estimates. They are inputted into REMM and form the basis of the employment forecasts.
Step 1
The employee capacity of each building of the commercial building stock is determined.
Step 2
DWS employment are located into the commercial buildings. This does not account for all of the employment in the county-wide totals.
Step 3
REMM's employee location choice models locate the remaining jobs (up to the county-wide totals) into the available commercial buildings.
Step 4
The estimates are presented to the MPO Technical Advisory Committee. The members are requested to review and provide feedback.
Task 4
TDM - Model Inputs
In early 2025, the transportation analysis zonal characteristics, transportation network characteristics, socioeconomic (SE) estimates, and college and airport trip tables are updated and collected in preparation for the TDM calibration. Current transit routes' alignment, frequency, and mode are collected from the Utah Transit Authority (UTA). The data is used to build a representation of the real world for 2023. Below are the main inputs for the travel model.
TRANSPORTATION ANALYSIS ZONES
A zone is a geographically defined area used to collect and analyze traffic-related data. It contains the area's walkability and developable acreage, along with several group classifications.
ROAD NETWORK
Aerial imagery is examined to discover new roads and changes in existing road characteristics such as lanes and functional type.
TRANSIT NETWORK
Every transit line that exists in the base year that can be modeled is coded into the transit network.
SOCIOECONOMICS
An interim SE forecast is used for initial planning while the official forecast is produced. The interim SE forecast is the previous RTP's forecast adjusted from the base year 2019 to the new housing and jobs estimates for 2023.
As the new SE forecast is drafted and finalized in Task 8, the TDM will utilize the new SE forecast.
SPECIAL TRIPS
Current and projected airport passengers, college students, and state park visitors are needed to account for these atypical trip productions and attractions.
Trips starting and/or ending outside of the modeled space must also be accounted for. These trips come from the statewide travel demand model.
Task 5
TDM - Model Calibration
In the spring of 2025, data from the Utah Department of Transportation (UDOT) and the Utah Transit Authority (UTA) for the year 2023 is collected. UDOT data includes the average annual daily traffic, traffic by time of day, and traffic by day of week. UTA data includes transit ridership, boardings, and rider profiles. To capture the latest travel behavior, Utah's four MPOs, UDOT, and UTA conducted a household travel survey in 2023. A comparison to the survey data is made each time the model is adjusted. The 2019 TDM is calibrated to a travel survey conducted in 2012; here is its validation report.

2023 TRAVEL SURVEY
Over 25,000 Utahns from 9,799 participating households
Model parameters are adjusted to best mimic the travel behaviors and travel patterns from the survey.
AMERICAN COMMUNITY SURVEY
Mode share, vehicle ownership, age, and income.
Model parameters are adjusted to best match the data from the survey.
TRAFFIC COUNTS
Model parameters are adjusted to produce vehicle trips that come as closely as possible to the traffic counts.
TRANSIT RIDERSHIP
Model parameters are adjusted to produce transit trips that come as closely as possible to observed transit boardings.
Task 6
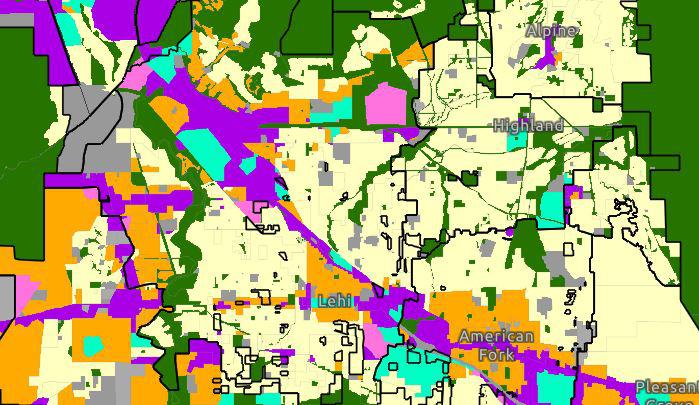
REMM - Land Use Capacity
In the fall of 2025, general plan land use layers are gathered from each city and county. As REMM projects growth, it needs to know where and what can and can't be built. Density is used to determine how many residential units are allowed in any given space and how many stories a commercial building can be. The land-use layers listed below make up the capacity layer that informs REMM of the allowed densities.
GENERAL PLAN LAND USE
Collected from each city and county and combined into one file. This acts as the default capacity layer.
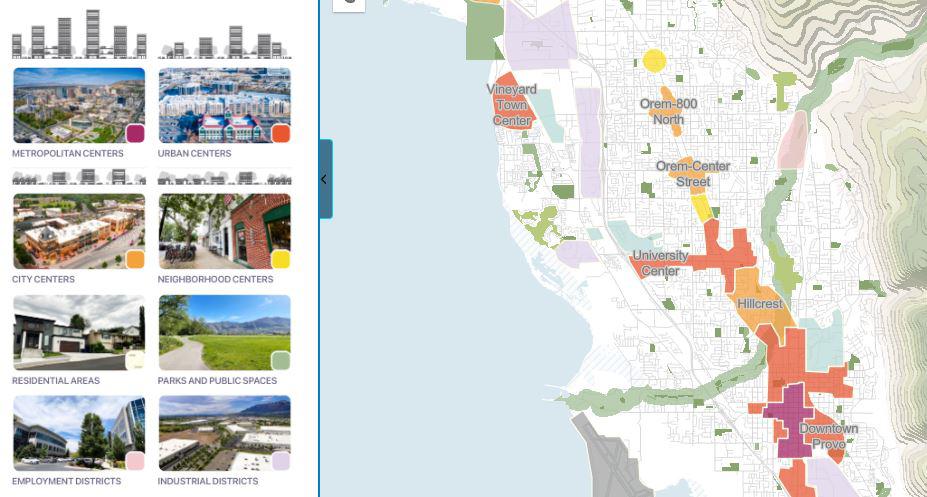
WASATCH CHOICE CENTERS
These centers overwrite the land use and densities of the community's general plan in the REMM capacity layer. Depending on the center's market demand, the overwrite may happen in a future year.
STATION AREA PLANS
Several Station Area Plans are in development for areas around each fixed transit station. These plans will overwrite the land uses and densities of the community's general plan in the REMM capacity layer.
LOCAL FEEDBACK
A review of each of the above layers in discussions with each city and county helps to determine which areas of their community feel development pressures and which areas are restricted from current development. Upcoming changes to a city's general plan land use are also gathered in these discussions.

Task 7
REMM - Building Stock +

In August 2025, three datasets are gathered: building permits from Construction Monitor, GIS parcel building data again from the County Assessor's Office, and information on approved and upcoming real estate developments from each city and county. To account for the population and job growth that happens after the 2023 base year estimates, a list of new buildings from the building stock, the building permits, and projects from upcoming developments is input into REMM and is built into the forecast in the year specified in the data. This data adds real-world housing units and commercial buildings through the year 2025 with some developments extending a few years after that.
Step 1
Building Stock
REPEAT TASK 1
Estimates the population to two years (instead of four years) before the RTP adoption. It also captures growth as up-to-date as possible for use in modeling.
Step 2
Building Permits
LOCATE NEW CONSTRUCTION
Locates the permit data geographically. This data is used to verify the building stock data and capture new buildings to be finished within the following year.
Step 3
Approved Developments
ADD NEAR-TERM FUTURE CONSTRUCTION
Meetings with each city and county to obtain information on upcoming real estate developments.
Task 8
TDM - Socioeconomic Forecast
From the summer of 2025 to the end of that year, many iterations and refinements with REMM are done.
Step 1
FINE-TUNE REMM INPUTS
Test REMM's sensitivities to multiple adjustments of the capacity layer, redevelopment factors, and transportation options.
Step 2
COMPARE FUTURE TO HISTORY
Each model scenario's city totals are checked against its historic totals for consistency.
Step 3
AVERAGE RESULTS
REMM has a randomness factor in its function. Once a final scenario is chosen, five model runs are averaged together to ensure consistency and remove outliers.
Step 4
POST-MODEL ADJUSTMENTS
No model is perfect and needs thorough review and adjustments. This creates the first draft forecast.
Step 5
LOCAL FEEDBACK
The draft forecast is presented to the MPO Technical Advisory Committee. The members are requested to review and provide feedback with data that may require additional adjustments to the forecast.
Step 6
MPO BOARD APPROVAL
After all adjustments are made to the forecast, the city-level forecast is presented to the MPO Technical Advisory Committee and to the MPO Board for approval.
Task 9
RTP - Project Needs Assessment
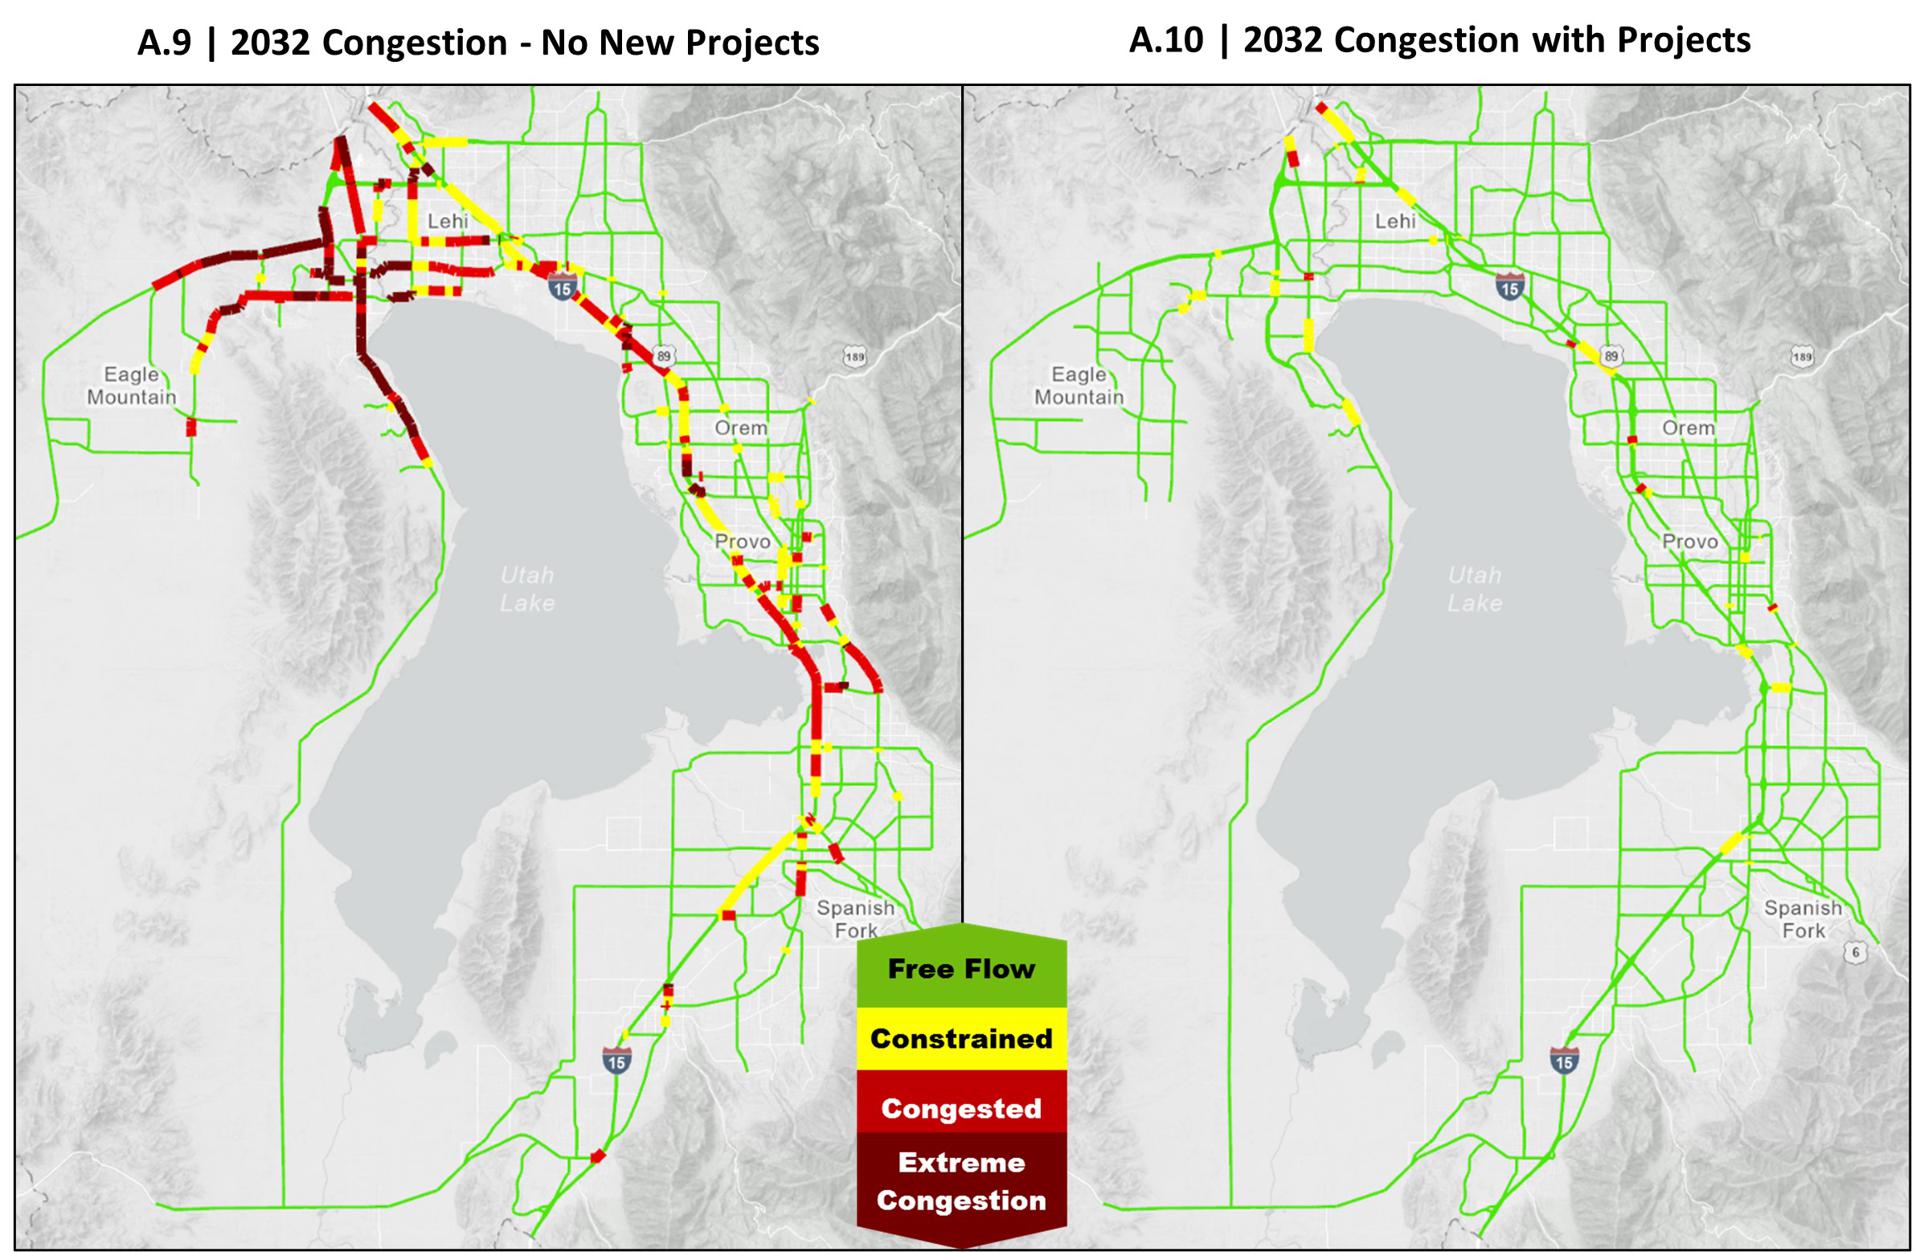
This task describes how we use the model in the RTP's prioritization criteria, Growth and Congestion. In late 2025, the transportation master plan (TMP) from each city is gathered. Using the socioeconomic forecast, a no-build scenario for each phase of the RTP is run with the TDM. The model identifies where the traffic is congested and where a solution is needed. Multiple transportation solutions are tested and analyzed to find the right combination of solutions. Solutions are selected from the cities' TMPs first. If the needed solutions are not included in the TMPs, MAG works with the city to discuss other options. Phase 1 solutions include projects already funded in the Transportation Improvement Program (TIP). The modeled traffic in this assessment is one of six performance metrics used to select the needs-based projects for the RTP. Phase 1 of the upcoming RTP includes the years 2027 to 2036, phase 2 includes 2037 to 2046, and phase 3 includes 2047 to 2055.
Step 1
NO BUILD SCENARIO
Run the TDM with phase 1 socioeconomics but using the current transportation network.
Step 2
CONGESTION
Identify corridors that have a modeled traffic volume to roadway capacity ratio of over 0.9 (approx. Level of Service D).
Step 3
TEST SOLUTIONS
Step 4
REPEAT FOR EACH PHASE
Phase 2 is run with the phase 1 network. Solutions are added to a new phase 2 network. Phase 3 is run with the phase 2 network. Solutions are added to a new phase 3 network.
Task 10
Information Sharing
When a data product is complete, any webpage or map that uses that dataset is updated. Once the web pages and maps are updated, the members of the MPO Technical Advisory Committee are informed. The Unified Plan website will update its web maps once all agencies (the four MPOs of the state and UDOT) finalize the data for their planning areas.
As the MPO staff continue their process to produce the RTP, they use the following data products along with other metrics derived from the Real Estate Market Model and the Travel Demand Model to have data-informed plans and solutions.

Building Stock Application

Community Profiles
Socioeconomic Forecast
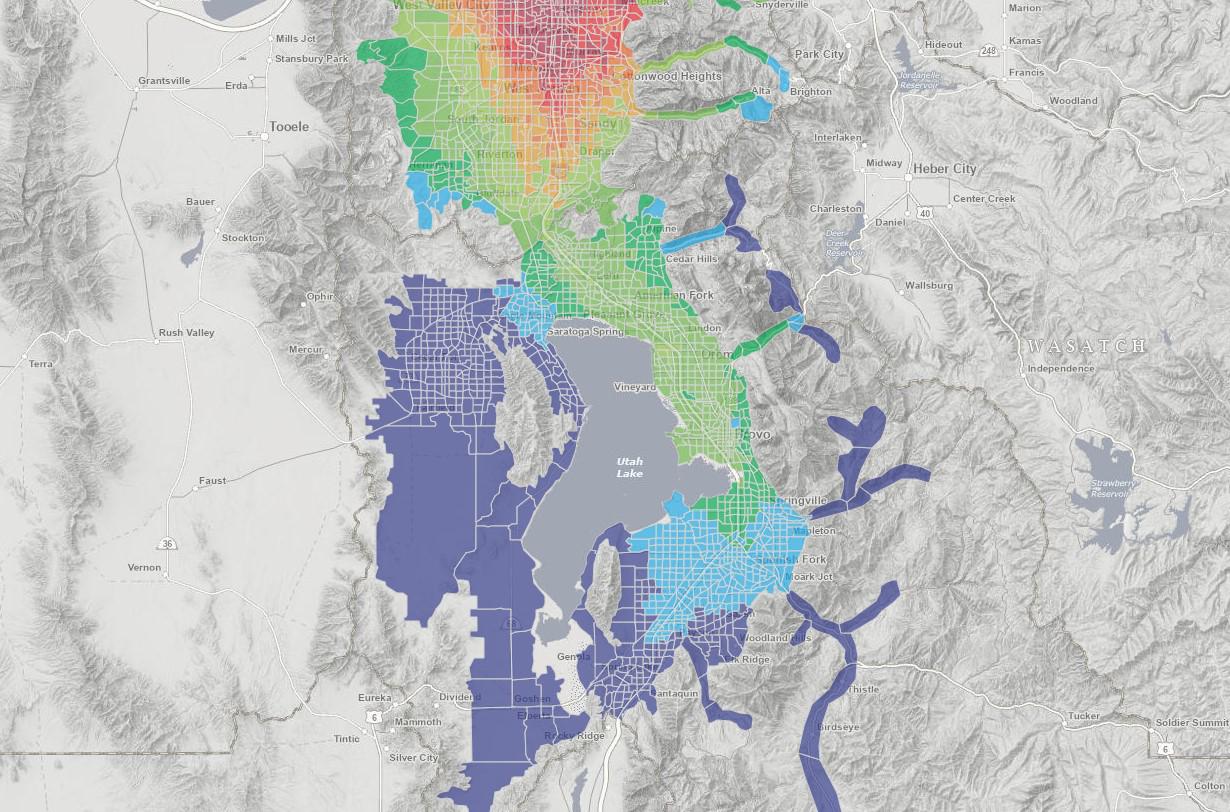
Access to Opportunities

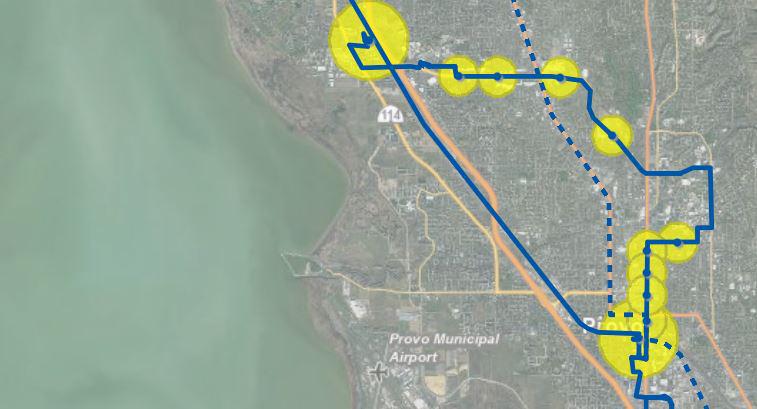
Traffic Forecast

Combined General Plans

RTP Projects Map
Various Unified Plan Applications